Showing posts with label Nitrogen. Show all posts

N 1s for Organic Nitrogen Species

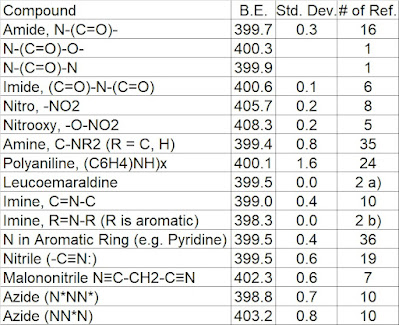
Table 1. Summary of N 1s binding energies [1,2].
a) 399.4 -399.6 eV found for leucoemaraldine [3]
b) 398.3 to 398.5 eV found for emeraldine/pernigraniline [3]

Other species of interest:
Isocyanate (R-N=C=O), 400.0 eV [4] (from bulk methylene diphenyl di-isocyanate)

References:
[1] C.D. Wagner, A.V. Naumkin, A. Kraut-Vass, J.W. Allison, C.J. Powell, J.R.Jr. Rumble, NIST Standard Reference Database 20, Version 3.4 (web version) (http:/srdata.nist.gov/xps/) 2003.
[2] G. Beamson, D. Briggs, High Resolution XPS of Organic Polymers - The Scienta ESCA300 Database Wiley Interscience, 1992.
[4] S. Tardio, M.-L. Abel, R.H. Carr, J.F. Watts, Int. J. Adhes. Adhes. 88 (2019) 1-10.

Nitrogen

Table 1. Nitrogen 1s binding energy values [1].

a) The binding energy values for nitrogen in organic compounds overlap significantly and can be difficult to decipher especially if there are multiple nitrogen containing groups. An excellent resource is Appendix 4 in the "High Resolution XPS of Organic Polymers - The Scienta ESCA300 Database"[2].

References:
[1] C.D. Wagner, A.V. Naumkin, A. Kraut-Vass, J.W. Allison, C.J. Powell, J.R.Jr. Rumble, NIST Standard Reference Database 20, Version 3.4 (web version) (http:/srdata.nist.gov/xps/) 2003.
[2] G. Beamson, D. Briggs, High Resolution XPS of Organic Polymers - The Scienta ESCA300 Database Wiley Interscience, 1992.

Chromium Nitride (CrN)

The Cr 2p3/2 spectrum of chromium nitride (CrN) can be fit using the following peak shape parameters (for a 20 eV pass energy spectrum). 

Peak shape: LA(3.4,25,17)
Peak width: 2.10 eV
Position: 574.6-574.8 eV

Note that other reports suggest a higher binding energy position of up to 576 eV [1,2].

The peak shape is asymmetric and much broader then the metallic peak. There is a slight hump near the top of the peak on the lower binding energy side of the peak.  Assessment of the amount of nitride present in the Cr 2p spectrum should be taken in light of the amount of nitride seen in the N 1s spectrum and the total amount of N and Cr in the survey spectrum. 

The spectrum presented below is consistent with that reported on in Reference [3] taken using a lower resolution instrument.  The spectrum from [3] also shows an asymmetric peak shape and has a FWHM of 2.9 eV. However, the lower binding energy hump is less discernible.
Cr 2p spectrum of chromium nitride (CrN).
References:
[1] O. Nishimura, K. Yabe. J. Electron Spectrosc. Relat. Phenom. 49 (1989) 335.
[2] A. Lippitz, Th. Hubert, Surf. Coat. Technol. 200 (2005) 250.
[3] I. Milosev, H.H. Strehblow, B. Navinsek, P. Panjan, Surface Science Spectra, 5 (1998) 138.

Titanium Nitride

Entries from the NIST database [1] give the following results for titanium nitride:
Ti 2p3/2 = 455.5 eV +/-0.4 eV
N 1s = 397.1 +/-0.3 eV
The Ti 2p peak for the nitride appears to have an asymmetric peak shape and can, in lower resolution work, be fit similar to the metal.

Recent, excellent, high resolution work by Jaeger and Patscheider [2] shows that the asymmetry is comprised of several shake-ups and plasmons. Bulk and surface plasmons for the Ti 2s peak and N 1s peak are also found in this paper.

Table 1. Titanium nitride binding energies (eV), assignments and FWHM from [2]. Reproduced with permission from Elsevier Limited, Oxford, UK.

Figure 1. Ti 2p peak for titanium nitride from [2]. Reproduced with permission from Elsevier Limited, Oxford, UK.

An excellent account of the species present (Ti and N) in an air exposed film of titanium nitride is presented in reference [3].

References:
[1] C.D. Wagner, A.V. Naumkin, A. Kraut-Vass, J.W. Allison, C.J. Powell, J.R.Jr. Rumble, NIST Standard Reference Database 20, Version 3.4 (web version) (http:/srdata.nist.gov/xps/) 2003.
[2] D. Jaeger, J. Patscheider, J. Electron Spectrosc. Relat. Phenom. 185 (2012) 523-534.
[3] N.C. Saha, H.G. Tompkins, J. Appl. Phys. 72 (1992) 1.